For my public speaking class, I decided to ask my students to create an infographic with personal information in order to present to their classmates; this would allow them not only to continue developing their PS skills, but also to learn about infographics, the benefits of using them as a presentation technique, and how to design their own. In case you’re not familiarized with the term, an infographic is a mode of showing data in an eye-catching way through images, icons, graphs, diagrams, colors and short chunks of text.
As I started searching for resources on how to create infographics and became familiar with this data visualization form myself, I was surprised to find some very intuitive free user-friendly websites, which I will mention a little later. It is definitely a great alternative for presentations, not only for visual learners, but for any type of audience, considering that nobody really likes to learn about any type of information through plain boring text, or do they? Hence, I decided to plan three sessions for this purpose; one of them carried out with an in-class flip approach.
The Task: Ten Things You Don’t Know About Me
The task students were to carry out consisted of a “Ten things you don’t know about me” infographic and it was developed in three sessions with pre-class work and in-class work (See infographic 1). Each session was 70 minutes long.
Infographic 1. Lesson Planning for Infographics Task. Information on how sessions were divided in pre and in-class tasks. (Made in easel.ly)
Session 1: The in-class flip
For the first class, where the task and concept of infographics would be introduced, I planned an in-class flip. Students were asked to explore three websites as a pre-class task as well as to sign up to the site they liked the most. Then, in class they would work in three stations.
Recommended resources:
In order to decide which resources to use, I browsed through different infographics design websites, signed up to many and tried them out by creating a simple design in each. In the end, I chose three sites I considered user-friendly with interesting and varied templates and icons as well as a download option for students to print their creations, which came with the free membership option.
These were the websites I recommended:
Most students went with Easelly, but I also had students who used Canva and Piktochart. They all have different features and are very easy to use, in my opinion.
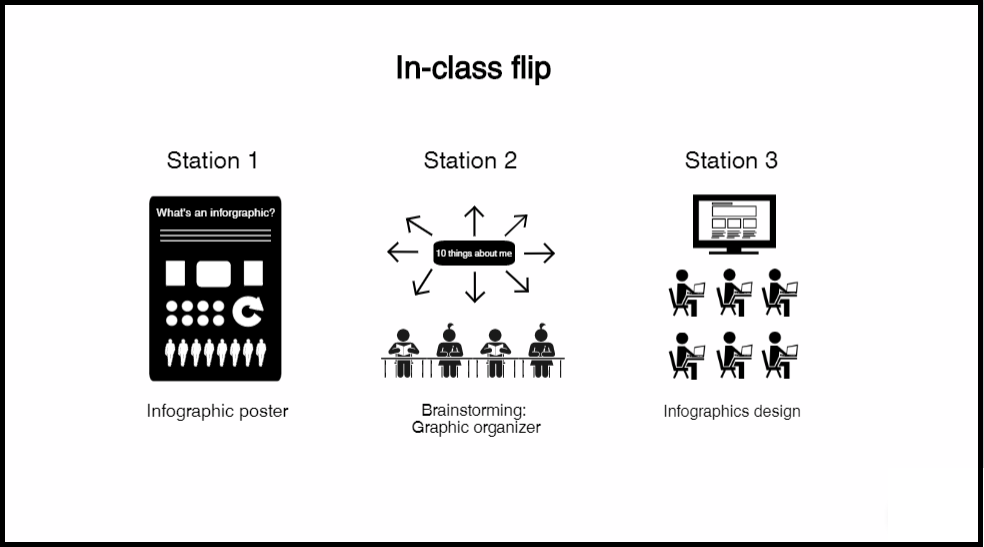
For the in-class portion of this session, the station work was organized in the following way:

Infographic 2. In-class flip station work. (Made in easel.ly. Icons from flaticon.com)
Station1:
In this station, two infographics were printed out in double letter size and pasted on a wall. Then, students were divided into two groups of 8 each and each group was directed to one poster on each side. That way they could read the infographic easily and take notes of the key information.
Here students worked in their own time. As they finished this first activity, they continued to station 2.
Station 2:
This station contained 16 graphic organizers placed on two desks for students to take and complete. This was a brainstorming task in which students were asked to think of ten things their classmates did not know about them, which they were willing to share. I encouraged them to write and doodle in order to also think about how their information could be visually represented. As students finished, they were prompted to continue to station 3. The ones who worked at a slower pace went when they were ready.
Station 3:
In this last station there was a laptops cart. Students were required to take a laptop and sign in to the inforgraphics website they had previously chosen and signed up to. Here their goal was to start creating their infographic based on the ideas they had jotted down in the second station, which they would continue to create next class.
Image 1. Classroom set-up for station work. From right to left – Station 1 posters; Station 2 graphic organizer on desk; Station 3 laptop cart.
Session 2: Infographic Design
In the following class, students were focused on the design stage; each one was provided with a laptop to work with. My role was to monitor and provide support. By the end of the lesson, most students were able to finish their design within class time. Nevertheless, there were a couple of students who finished the work at home. Since part of the criteria of this task was to present with a printed inforgraphic in a type of poster session dynamic, students were requiered to bring their printed infographic in session 3.
Session 3: Presenting
Upon arrival, students were handed tape and asked to put their infographics up on the walls of the classroom. These were stretched out around the classroom, so the poster session dynamic could be carried out appropriately. Because I had 60 minutes for all 16 students to present, I decided to divide them in 4 groups of 4. To do so, students were asked to choose a color from a set of foamy sticks. There were four colors: red, green, yellow and blue. After each student had chosen a stick, they were grouped according to the color they had. In this way, the students of one group (e.g. red group) were assigned a moment to present and the members of that group would simultanously present to different classmates in 4 rotation moments. Each presenter had exactly 3 minutes to speak. I had a timer and indicated when time was up in order for rotation to occur.

Diagram. Distribution of presenters and rotation scheme.
(Made with draw.io)
When it was the next group’s turn (e.g. green group), they got in position in front of their infographics and the remaining students distributed themselves among the 4 presenters. The same dynamic as with the red group was repeated until all students had the chance to present. In order to assess each student, I made sure to rotate with one group until I was able to hear all presenters.
In the end, thanks to strict time management and rotation organization, all students were able to present, despite the case of 3 students who had not come prepared and ended up presenting with laptops (plan B).
Assessing the task
For the purpose of assessing the oral presentations along with the infographic each student designed, I created an Infographic checklist that took both aspects into consideration. During the oral presentations, I took notes of students’ mistakes and then collected the infographics to grade them; students who hadn’t printed them sent them to my email. Finally, grades were given the following class with the checklists and infographics.
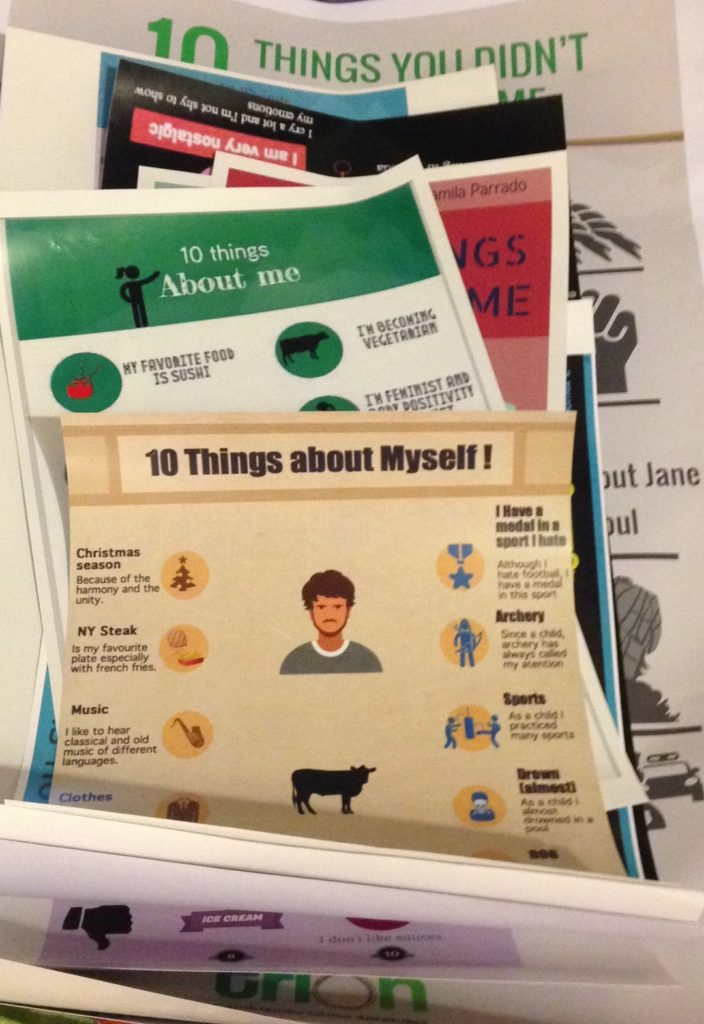
My student’s printed infographics
What I learned
After reflecting on what worked and what could improve, here are my thoughts.
- The inforgraphic about inforgraphics was clear. Next time I could print it in a size a little bigger.
- The in-class flip allowed students to work at their own pace, which did not interfere with the task, since they would continue the design stage in session 2.
- Many students struggled to come up with ten things about themselves. That’s why I decided to provide examples about my own life (favorite things, family, specific issues, preferences, etc), which seemed to help. Some of them said “their life was boring and they had nothing to share”. Of course, in the end, they all had very unique and interesting information to share.
- Some students did not comply with printing their infographics, so plan B came in place with laptops.
- The logistics of the final presentations could include not only dividing students by colors, but also by assigning a number that would directly lead them to the presenter they should start with and rotate from there. Since this was not the case, I had to make sure there was three students per presenter.
- Teaching about infographics has led me to use infographics more comfortably and to come to the conclusion that I don’t need to have advanced design skills to get an idea through in a visual format.
- I loved this class!


Awesome post!!! Great way to create appealing content and to encourage the use of infographics… This proves they can be used to display information about any topic. Thank you!
Absolutely! Thank you for your comment! 🙂
Great work, as usual! I think this is an excellent task: authentic and appropriate, engaging and relavent. Thanks for sharing.
Thanks Kevin! 🙂